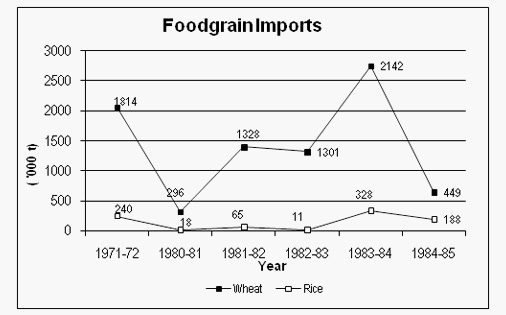
1. Wheat formed what percent of the volume of total imports of food grains from 1980 – 85?
1. 75%
2. 66%
3. 90%
4. 95%
5. 87%
Answer Option: 3
Adding up the approximate quantity of wheat and dividing it by the total quantity of foodgrains (i.e. wheat + rice) will give us ≈ 5516 / 6126 ≈ 90 %.
2. If the import price of wheat was Rs. 2,400 per tonne in 1983-84, then what was the import price of rice per tonne during that year (in Rs.)?
1. 3,200
2. 2,225
3. 2,850
4. 1,800
5. Can't say
Answer Option: 2
In '83-84, 2,142,000 tonnes of wheat @ Rs. 2,400/tonne will mean an expenditure of Rs. 514 crore. So the remaining is 587 – 514 = 73 crore, which was spent on importing 328,000 tonnes of crore. So the price of rice = 730,000 / 328 ≈ Rs. 2,225 /tonne.
3. In which year was the ratio of rice to wheat imports the highest?
1. 1971 – 72
2. 1980 – 81
3. 1983 – 84
4. 1984 – 85
5. 1981 – 82
Answer Option: 3
The ratio is maximum when the numerator is maximum and the denominator is minimum. In the year 1984-85 the imports of rice are highest and the imports of wheat is the least which gives the maximum ratio.
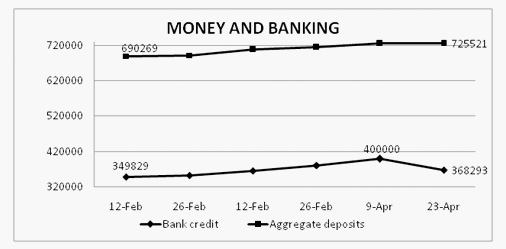
DIRECTIONS for questions 4– 6: Refer to the line graph below and answer the questions that follow:
4. Given below are three statements. Select from the choices given, the FALSE statement(s).
I. The growth rate in aggregate deposits has been more than the growth in bank credit over the given period.
II. The percentage of bank credit to aggregate deposits has declined over the given period.
III. The growth of bank credit follows the same trend as the growth in aggregate deposits.
1. Only I
2. I and II
3. Only III
4. I, II & III
5. II and III
Answer Option:4
Statement I is false as growth in aggregate deposits is 5.11% and growth in bank credit is 5.27% over the given period.
Statement II is false as percentage of bank credit to aggregate deposits on 12 Feb is 50.68 while the percentage of bank credit to aggregate deposits on 23 Apr is 50.76. So it has increased not declined.
Statement III is false as we can see from the graph that growth of bank credit is not following the same trend as growth in aggregate deposits.
Hence all statements are false. So, answer is option 4.
5. If CRR (percentage of deposits to be kept as reserves by banks) is 12%, then what is the amount of money which is lying unproductive in banks as on April 23?
1. Rs 2,701,265 crore
2. Rs 3,001,685 crore
3. Rs 2,803,733 crore
4. Rs 270,175 crore
5. Rs. 87,062 crore
Answer Option: 4
CRR = 12% of 725 = 87. Money with banks after giving credit = 725 – 87 – 368 = 270.
6. If the trend of the period Apr 9-Apr 23 continues, what would be the bank credit as on May 7?
1. 320
2. 330
3. 338
4. 345
5. 450
Answer Option: 3
The trend is declining from almost 400 to 368, a decrease of about 8%.
On May 7 it should be 368 x 0.92 = 338.56 = close to 338.
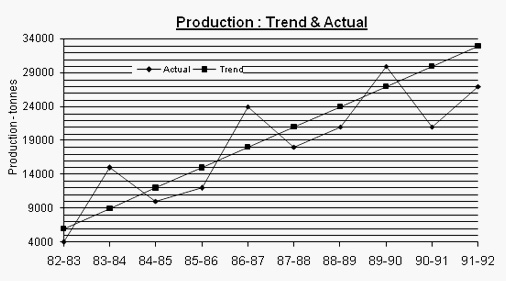
9. What has been the maximum deviation of actual from the trend?
1. –20%
2. +33%
3. +66%
4. –40%
5. –30%
Answer Option: 5
Maximum deviation is in the year of 90-91.
Actual value is 21000 and trend value is 30000. Deviation of actual from the trend is
((-)9,000/30,000) x 100 = -30 %. Hence the answer is 5.
10. How many times has the actual production shown a more than 50 % increase over the previous year?
1. Once
2. Twice
3. Thrice
4. Never
5. Four times
Answer Option: 2
From the graph it can be seen in the years 83-84 and 86-87 actual production shows increase of more than 50 % over the previous year. Hence the answer is 2.

 (1)_2.jpg?null)


 (1)_12.jpg?null)


