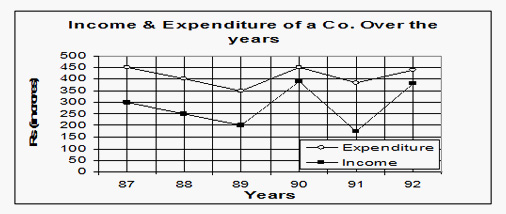
1. The aggregate expenditure of which of the following sets of years was equivalent to the income in 1990?
A. 1987 & 1988
B. 1987 & 1989
C. 1988 & 1989
D. None of these
Answer Option: D
Going by options: For 1987 & 1988, the total expenditure = 450 + 400 = 850 cr.
For 1987 & 1989 the total expenditure = 450 + 350 = 800 cr.
For 1988 & 1989 the total expenditure = 400 + 350 = 750 cr.
Income in 1990 = 400 cr. None of the options satisfies.
2. What was the approximate percentage decrease in income from 1987 to 1988?
A. 80%
B. 50%
C. 17%
D. 40%
Answer Option: C
Income in 1987 = 300 cr. Income in 1988 = 250 cr.% Decrease = 300 - 250 / 300 x 100 = 16.66%
3. In what number of the given years was the expenditure more than the average expenditure of the given years?
A. 4
B. 3
C. 1
D. 6
Answer Option: B
The average comes out to be around Rs 410. There are 3 years having expenditure more than the average expenditure.
4. In which of the following years was the ratio of expenditure to the income, the lowest?
A. 1987
B. 1988
C. 1989
D. 1990
Answer Option: D
For 1987, % of expenditure to Income = 450 / 300 = 1.5
For 1988, % of expenditure to Income = 400 / 250 = 1.6
For 1989, % of expenditure to Income = 350 / 200 = 1.75
For 1990, % of expenditure to Income = 450 / 400 = 1.125
Obviously it is lowest for 1990.
5. What was the approximate percentage increase in expenditure from 1989 to 1990?
A. 35%
B. 40%
C. 20%
D. None of these
Answer Option: D
Expenditure in 1989 = 350 cr. Expenditure in 1990 = 450 cr. %increase =
450 - 350 / 350 x 100 =28.57%
None of the options satisfies.
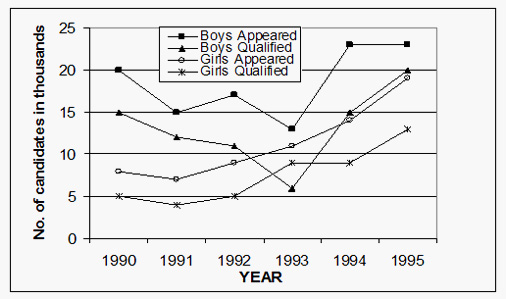
DIRECTIONS for questions 6-10: Study the following line chart carefully and answer the questions given below:
Number of candidates (Girls & Boys) Appeared & Qualified Over the Years
6. The percentage (approximate) of boys qualified to appear in the year 1995 was?
A. 35%
B. 86.95%
C. 80%
D. 65%
Answer Option: B
Boys qualified in 1995 = 20 thousand. Boys appeared in 1995 = 22.5 thousand
Required %age = 20 / 23 x 100 = 86.95%.
7. Which two consecutive years had the same number of qualified girls?
A. 1994 and 1995
B. 1993 and 1994
C. 1991 and 1992
D. 1992 and 1993
Answer Option: B
Number of girls qualified in 1993 and 1994 are same.
8. What was the % increase in the no. of boys qualified from 1994 to 1995?
A. 50%
B. 33.33%
C. 100%
D. 150%
Answer Option: B
Number of boys qualified in 1994 = 15. Number of boys qualified in 1995 = 20.
% increase = 20-15 / 15 x 100 = 33.33%
9. The difference between the total number of boys & girls qualified in 1990 and 1995 was
A. 5000
B. 2000
C. 7500
D. 13000
Answer Option: D
Total number of boys & girls qualified in 1990 = 15 + 5 = 20 thousand
Total number of boys & girls qualified in 1995 = 20 + 13 = 33 thousand
Required difference = 13000
10. Which year had the lowest percentage of girls qualified to appeared among the years given?
A. 1991
B. 1993
C. 1994
D. 1992
Answer Option: D
In the year 1991,percentage of girls qualified to appeared = (4/7) x 100 = 57.14%
In the year 1992,percentage of girls qualified to appeared = (5/9) x 100 = 55.55%
In the year 1993, percentage of girls qualified to appeared = (9/11) x 100 = 81.81%
In the year 1994, percentage of girls qualified to appeared = (9/14) x 100 = 64.2%
i.e.55.55% is lowest.

 (1)_2.jpg?null)


 (1)_12.jpg?null)


