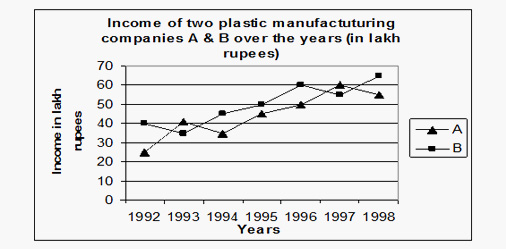
Example 1. What would be the ratio of income of company B in 1996 to the income of company A in 1993?
A. 9 : 10
B. 10 : 9
C. 3 : 2
D. 15 : 13
Solution
Income of Company B in 1996 = 60 lakh. Income of company A in 1993 = 40 lakh. Required ratio = 60 / 40 = 3:2
Example 2. If the expenditure of company B in 1997 is Rs. 50 lakhs, the percent profit earned by both the companies A and B in 1997 is equal, then what is the amount of profit earned by company A in 1997 (approximately)?
A. Rs. 5 lakhs
B. Rs. 4.5 lakhs
C. Rs. 5.5 lakhs
D. Rs. 6.2 lakhs
Solution
Income of company B in 1997 = 55 lakh. Expenditure of company B in 1997 = 50 lakh. % profit = 10%
Expenditure = 60 / 1.1 = 54.5 ⇒ amount of profit = 60 – 54.5 = 5.5 lakh
Example 3. If in the year 1995, company 'B' had a profit of 25%, what approximately was its expenditure in the year 1995 ?
A. Rs. 22 lakhs
B. Rs. 29 lakhs
C. Rs. 40 lakhs
D. Rs. 27 lakhs
Solution
For company 'B' profit = 25%. Income of company B = 50 lakh in 1995
Required expenditure = 50 / 1.25 = 40 lakh
Example 4. The average income of company 'B' per year is what percentage of the average income of company 'A' per year?(approximately)
A. 70%
B. 110%
C. 113%
D. 90%
Solution
Average income of company A = (25 + 40 + 35 + 45 + 50 + 60 + 55) / 7 = 44.285
Average income of company B = (40 + 35 + 45 + 50 + 60 + 55 + 65) / 7 = 50
Required %age = 50 / 44.285 x 100 = 112.9% ≅ 113%
Example 5. Income of company 'A' in 1996 is what percent of income of company 'B' in 1992?
A. 75%
B. 63.64%
C. 133.33%
D. 125%
Solution
Income of company B in 1992 = 40 lakh. Income of company A in 1996 = 50 lakh
And 50 lakh is 125% of 40 lakh.
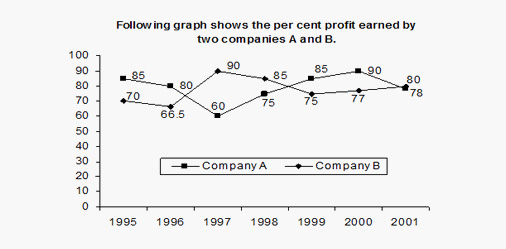
DIRECTIONS for question 6-10: Study the following graph carefully and answer accordingly.Following graph shows the percent profit earned by two companies A and B on their investments.(Revenue = Investment + Profit)
Example 6.Revenue of company B in 2000 was Rs.1239 lakhs. What was the investment in that year (in Rs lakhs) of company B?
A. 700
B. 800
C. 650
D. 193.03
Solution
Investment of company A in 2000 = 1239 x 100 / 177 = Rs.700 lakh
Example 7. Investment of company B in 1998 was 20% more than that in the previous year. Profit in 1998 of company B was what per cent of its profit in 1997?
A. 10%
B. 102(2/3)%
C. 106(2/3)%
D. None of these
Solution
Let us assume the investment of Company B in 1997 is Rs. 100. Investment of company B in 1998 was 20% more than that in the previous year.
So the investment of Company B in 1998 is Rs. 120.
Profit in 1997 of company B= 90 % of 100 = Rs. 90
Profit in 1998 of company B= 85% of 120 = Rs. 102.
Required % = 102 / 90 x 100 = 113 (1/3)%
Example 8. In which of the following years is the ratio of investment and profit maximum for company A?
A. 2001
B. 1995
C. 1998
D. 2000
Solution
Quicker Method: The ratio of investment and profit will be maximum when percentage profit is minimum. Therefore, the ratio of investment and profit will be maximum in 2001.
Example 9. If the revenue of company B in 1996 was same as the revenue of company B in 1999, what would be the ratio of investment of company B in 1999 to the investment of company B in 1996?
Example 10. In which of the following years was the investment minimum for company B?
A. 1995
B. 1999
C. 2000
D. Can't be determined
Solution
We don’t have the data for investment. So, we can't determine the answer.
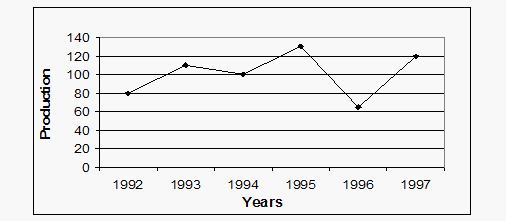
DIRECTIONS for questions 11 to 15: Given below are line graph examples with questions, which show the annual food grain production from 1992 to 1997. Refer to the graph & answer the questions based on line graph as given below.
Example 11: What is an approximate percentage decrease in production from 1993 to 1994?
A. 87.5%
B. 37.5%
C. 9.09%
D. None of these
Solution
Here we look up the values of the production for the 2 years first. Locate 1993 on the X axis, which denotes years. Move vertically up along the Y axis direction in 1993, and we get value of production in 1993 as 110. In the same way we get the value of production in 1994 as 100.
In calculating % increases & decreases: In this case 1993, it is very important to remember that the original year is the one that is used as the reference year. First we calculate the absolute decrease which is 110 – 100 = 10. Now we have to express 10 as a percentage of the production in 1993, which is 110. So the required answer is 100 × 10/110 = 9.09%. Hence answer is option C.
Example 12: The average production of 1994 and 1996 was approximately equal to production of which year?
A. 1996
B. 1992
C.1995
D. 1994
Solution
The production in 1994 was 100, that in 1996 was 62.5.
The average production of 1994 and 1996 = (100 + 62.5)/2 = 81.25.
This was approximately equal to production in 1992. Hence Answer is option B.
Example 13: The average production of the given years was more than to the production in how many years?
A. 1
B. 2
C. 3
D. 4
Solution
Average production for 6 years = 80 + 110 + 130 + 100 +120 +65 / 6 = 101
Clearly in 1992, 1994 and 1996, the production was less than average. Hence answer is option C.
Example 14: If the production in 1992 is estimated to be 60% more than that in 1991, the estimate of 1991 production is?
A. 120 units
B. 100 units
C.60 units
D. 50 units
Solution
The production in 1992 is 80 units. The Required production in 1991 =
80 / 160 x 100 = 50 Hence answer is option D.
Example 15: The maximum increase in food grain production has been in
A. 1997
B. 1996
C.1995
D. 1994
Solution
Here remember that absolute increase has been asked. The difference in Y coordinates of the adjacent years will give us the increase. Since the distance between consecutive years is the same on the X axis, we can check the slopes of various segments. By visual inspection, maximum increase in food grain production has been in the year 1997 (55 units by calculation).Hence, answer is option A

 (1)_2.jpg?null)


 (1)_12.jpg?null)


