
 (1)_2.jpg?null)
| Players | 180 |
| Officials | 1,400 |
| Spectators | 760,000 |
| Security | 17,000 |
| Volunteers | 14,000 |

| Que. No. | Answer Key | Explanation |
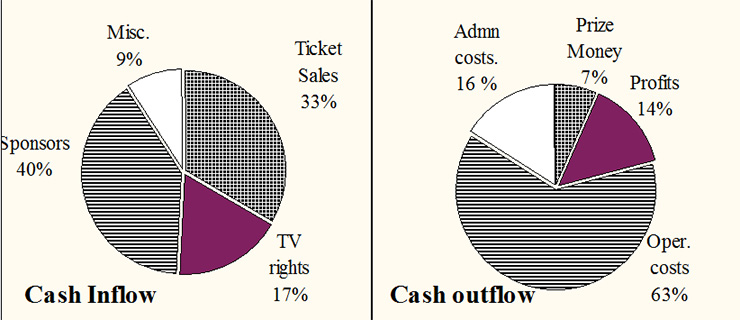
| 1. | 3 | Total profit = 14% of Rs 120 cr = 16.8 cr.; India’s share in profit = 3/6 × 16.8 cr = 8.4 cr Tax deduction = 30% of 8.4 cr = 2.52 cr; Post tax profit = 8.4 - 2.52 = Rs 5.9 cr |
| 2. | 4 | Operational cost = 63% of 120 cr = 75.6 cr; 25% to security = 75.6 × (25/100) = 18.9 cr Avg. cost of a security personnel = 1890 lakh / 17,000 = Rs 0.11 lakh. |
| 3. | 2 | Cash Inflow through Ticket Sales = 33% of 120 cr = 39.6 cr.; No. of Spectators = 760,000. Average Realization per Spectator = 396000000 / 760,000 = Rs 521 |
| 4. | 4 | Ticket sales at Rs 50/ticket = 50 × 14, 000 = Rs 7 lakh Ticket sales at Rs 300/ticket = 300 × 14,000 = Rs 42 lakh The required difference = Rs 35 lakh |
| 5. | 3 | Prize money = 7%; Sponsors = 40%. T.V. rights = 17%, So the required %age = (7/57) × 100 = 12%(approx.) |
| 6. | 4 | Required value = 17% of 1795 = Rs 305.15 cr. |
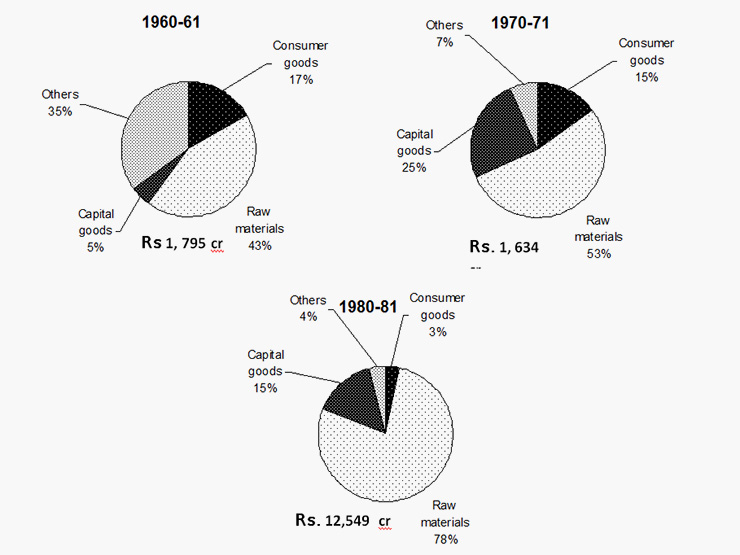
| 7. | 4 | %age of raw materials of the total in 1970-71 was 53%, while in 1980-81 it was 78%. So the difference in their percentage shares was an increase of approximately 25%. |
| 8. | 2 | Raw materials in 60-61 corresponds to 43% of Rs 1795 crore or Rs 771.85 crore. In 1970-71 it corresponds to53% of Rs 1634 crore or 866.02 crore. So, the difference is Rs 94.17 crore. |
| 9. | 3 | Capital goods in 1980-81 are 15% of the total of Rs 12549 crore or Rs 1882.35 crore. In 1960-61, the total is Rs 1795 crore. Thus, the difference is 87.35 crore. |
| 10. | 4 | We do not know the price of the non-nickel raw material, so we cannot make any judgment about the price of nickel. |


 (1)_12.jpg?null)


