Quick Review: Graphs and its Types

Graphs form an essential part of Data Interpretation. You need to be aware of the different kinds of graphs to handle DI questions accurately. 

Types of Graphs
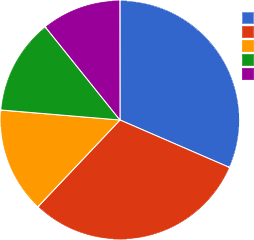
  1. Pie Chart/Circle Graph: As the word suggests, a circle graph is shaped like a circle. It is divided into fractions that resemble the pieces of a pie. Because of this reason, a circle graph is also known as a pie graph.
    Suggested Action:
    FREE Live Master Classes by our Star Faculty with 20+ years of experience.
    Register Now
  2. Bar Graph: A bar graph represents data by using graphs. The bars can be either be vertical or horizontal. The data can be in words or numbers.
  3. Histogram Graph: A graphical display of data using bars of different heights is known as a histogram graph.
  4. Line Graph: A line graph shows points plotted on a graph. These points are connected to form a line.
  5. Suggested Action:
    Kick start Your Preparations with FREE access to 25+ Mocks, 75+ Videos & 100+ Chapterwise Tests.
    Sign Up Now
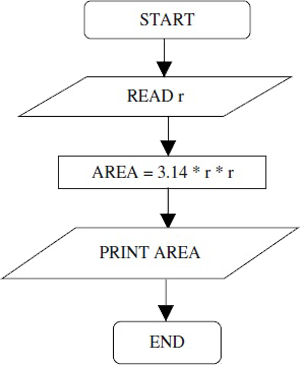
  6. Flowcharts: Flowcharts display a schematic process. Many companies use flowcharts to depict all the stages of a project. It helps to breakdown the process and understand the whole scenario.
cat
Rate Us
Views:50288