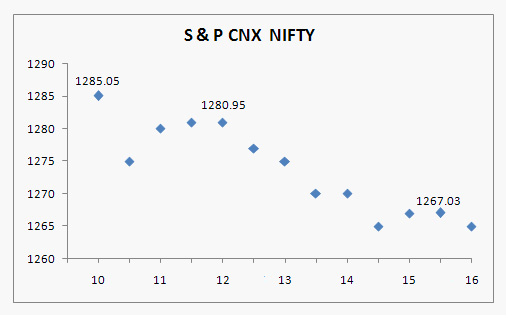
Option: 2 Explanation: Percentage fall in Nifty: (1,285 – 1,265)/1,285
= 18/1,285 = 1.4 %,
hence 98.50 is the best answer.
Price volatility (PV) is defined as: [(Highest - Lowest Price) / Average Price]. The PV of S&P CNX Nifty is closest to-
1. 0.10
2. 0.001
3. 0.01
4. 1.0
Option: 3 Explanation: 20/1,275 = 0.015.
Note that the other choices are too far.
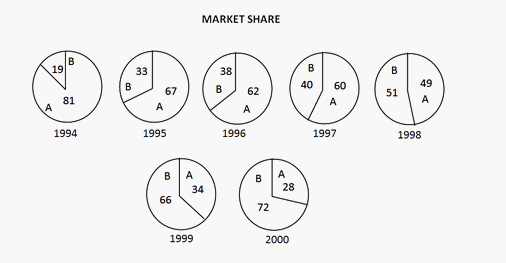
DIRECTIONS for questions 3 to 6: Refer to the graph given below which shows the total advertisement spending on television and the pie chart which gives the percentage share of the revenue of different players and answer the questions that follow:
A denotes DD share. B denotes C&S share. Figures in percentages.
What is the percentage increase of revenues of C & S from 1995 to 1996?
3. Increased at a faster rate initially, then declined
4. None of these
Option: 4 Explanation: The rate of growth is neither steady, nor can we say that it increased at a faster rate initially.
Hence 4.
The compounded annual growth rate (of the total TV advt. spending) from 1995-1999 would be closest to:
1. 27 %
2. 15 %
3. 42 %
4. 66 %
Option: 1 Explanation: 784 (1 + x)4 = 2077.
By hit and trial we get x = 27 % (approximately).
The method to do this is: first find the multiplication factor, in this case it is 2,077/784 = 2.65.
We know that (1.25)4 = 2.44 so the answer must be > 25 %.
If in 2001 the growth rate of C&S was same as that of 1999-2000, the total market share of C&S in 2001 would be:
1. 75 %
2. 76.7 %
3. 82 %
4. Can't be determined
Option: 4 Explanation: Since we do not know the total market in 2001, we cannot find out the market share for that year.
Hence 4.
Directions for question 7 to 10:Refer to the following questions which are based on the graph given below:
Requirement and Production of flowers over the years
The total of requirements in the year 1991 and 1992 is approximately what percent more than the total of production for these two years?
1. 0.098%
2. 9.8%
3. 0.98%
4. None of these
Option: 3 Explanation: Requirements for the years 91 and 92 = 190 + 325 = 515.
Production for the years 91 and 92 = 250+260= 510
Required percentage = 5 / 510 = 0.98%
During which year was the percentage increase in the requirement of flowers over the previous year, the maximum?
1. 1993
2. 1992
3. 1991
4. 1994
Option: 3 Explanation: In 1992, (325 - 190) / 190 x 100 = 71%
In 1991, (190 - 60) / 60 x 100 = 216.6%
In 1994, (290 - 220) / 220 x 100 = 31.8%
1991 percentage increase in the requirement of flowers over the previous year is the maximum..
If the production in 1995 were to decrease at the same rate percent as it decreased from 1993 to 1994, then what would have been the production in 1995(approx.)?
For which two years was the average annual production of flowers equal to the average annual requirements?
1. 1991 & 1994
2. 1992 & 1993
3. 1991 & 1992
4. 1993 & 1994
Option: 1 Explanation: Average annual production of flowers in 1991 & 1994= (250+290)/2= 270;
Average annual requirements of flowers in 1991 & 1994= (350+190)/2=270.
Hence option 1.


 (1)_2.jpg?null)


