Pie Chart Practice Questions: Level 01

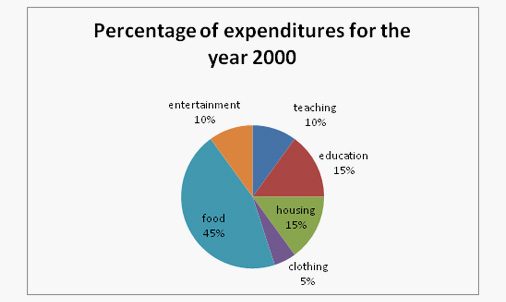
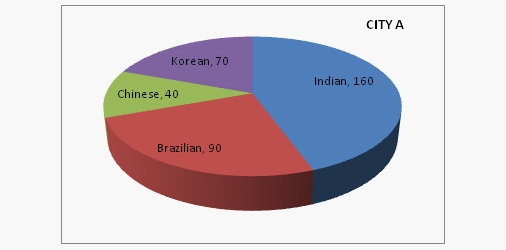
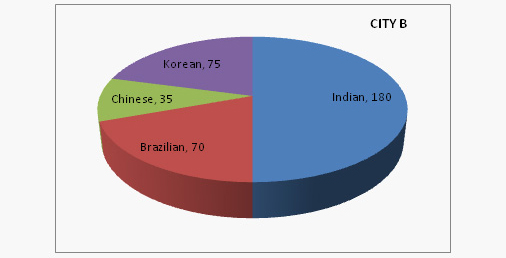
DIRECTIONS for questions 1-5: The pie chart given below shows the spending of a family on different articles for the year 2000. Analyse the pie chart and answer the questions which follow.
Suggested Action:
FREE Live Master Classes by our Star Faculty with 20+ years of experience.Register Now
  1. If the total amount that was spent in the year 2000 was 50000, the amount that was spent on food was
    A. Rs.225000
    B. Rs.22500
    C. Rs.24000
    D. Rs.21400
    Answer Option: B
    Amount spent on Food = 45% of Rs. 50000/- = Rs. 22500/-
  2. If the total amount that was spent in the year2000 was Rs. 48000, the amount that was spent on housing and clothing combined was
    A. Rs.9600
    B. Rs.8000
    C. Rs.10000
    D. Rs.12000
    Answer Option: A
    Amount spent on Clothing and Housing together = (15% + 5% = 20%) of 48000 = Rs. 9600/-.
  3. The ratio of the amount spent on teaching and education to clothing and food was
    A. 3:2
    B. 2:3
    C. 1:5
    D. 1:2
    Answer Option: D
    Required Ratio = 25% of total amt. / 50% of total amt. = 1/2
  4. According to the graph, the maximum amount that was spent was on which item (if the expenditure that is given to be Rs. 58256)?
    A. Food
    B. Housing
    C. Clothing
    D. Others
    Answer Option: A
    Irrespective of the total expenses, the maximum will be the maximum percentage which is for food i.e. 45% of 58256.
  5. If the amount spent during the year 2000 was Rs. 62000, the amount spent on clothing during the year was
    A. Rs. 1500
    B. Rs. 15000
    C. Rs. 3100
    D. Rs. 3200
    Answer Option: C
    Reqd. Expenditure = 5% of 62000/- = Rs. 3100/-
The following pie charts give the 'exact values' of people of different counties settled in City A and City B in the form of two pie charts.
  1. Indians which were in the city A form what percent of the total residents in the same city?
    A. More than 50%
    B. 25%
    C. Less than 50%
    D. Unknown
    Answer Option: C
    Indians in the city A are 160 and the total residents are 360.So, 160/360=44% approx.
  2. Indians in city B are what percent of the total persons?
    A. 40%
    B. 50%
    C. 12.5%
    D. Data inadequate
    Answer Option: B
    Indian residents in city B are 180, total people are 360. So the Indians are half of the total workers,thus 50%.
  3. Koreans of city A are what percent of the Koreans given in the city B?
    A. 93
    B. 97
    C. 96
    D. 90
    Answer Option: A
    Koreans given in the city A are 70, while in B are given to be 75. ATQ = (70 / 75) x 100 = 93% (approx)
  4. Suggested Action:
    Kick start Your Preparations with FREE access to 25+ Mocks, 75+ Videos & 100+ Chapterwise Tests.Sign Up Now
  5. Total Brazilians of both the cities form what percent of the total Indians given in both the charts?
    A. 22.22%
    B. 28.57%
    C. 47%
    D. 41.61%
    Answer Option: C
    Total Brazilians in both the cities are given to be 160.While Indians are in total 340 .Solving (160/340)*100=47%
  6. Koreans of city A form what percent of Chinese of city B?
    A. 200%
    B. 100%
    C. 50%
    D. 150%
    Answer Option: A
    Koreans of city A are 70 and Chinese of city B are 35. Required percentage = (70 / 35) x 100 = 200
Views:102784