Data Interpretation Practice Questions: Level 02

DIRECTIONS  for data interpretation questions 1 to 4: Study the tables given below and answer the questions that follow.
Suggested Action:
FREE Live Master Classes by our Star Faculty with 20+ years of experience.
Register Now
HOW THE BANKING SECTOR STACKS UP
Assets in US $ millions
Australia $ 384,436
China $ 1584,558
Hong Kong $ 278,008
India $ 162,355
Indonesia $ 136,997
Japan $ 6,567,077
Malaysia $ 117,629
Philippines $ 68,702
Singapore $ 129,005
South Korea $ 532,208
Taiwan $ 516,894
Thailand $ 219,965
Country Total Banks Assets as % of GDP
Australia 29 107%
China 25 44%
Hong Kong 29 188%
India 62 14%
Indonesia 199 19%
Japan 175 236%
Malaysia 37 62%
Philippines 37 35%
Singapore 12 184%
South Korea 25 101%
Taiwan 35 170%
Thailand 15 48%
  1. We can say that the largest banks (on the basis of assets) are present in:
    1. China
    2. Japan
    3. South Korea
    4. Taiwan
    5. Hong Kong
  2. India's GDP is how many times the GDP of Singapore?
    1. about the same
    2. Twice
    3. 10 times
    4. More than 16 times
    5. Cannot be determined
  3. In the following countries, the smallest banks in terms of assets exist in:
    1. Malaysia
    2. Philippines
    3. Thailand
    4. India
    5. Indonesia
  4. If the three biggest economies are ranked in descending order, they would be:
    1. China, Japan, Australia
    2. China, Japan, South Korea
    3. China, Japan, Taiwan
    4. China, Japan, India
    5. China, Japan, Malaysia
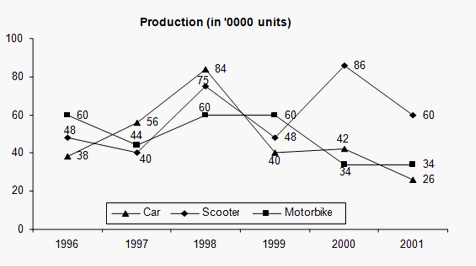
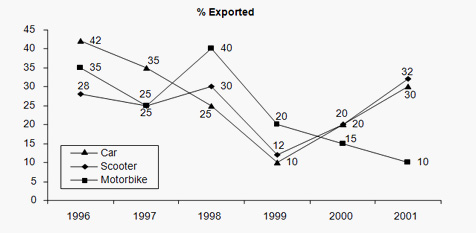
DIRECTIONS  for questions 5 to 7:Study the following line graphs which show the production (in '0000 units) and percentage exports of scooters, motorbikes and cars respectively over the years.
Data Interpretation Practice Questions Data Interpretation Practice Questions
  1. In which of the following years was the production of cars more than 50% of the total production?
    1. 2000
    2. 2001
    3. 1998
    4. None of these
  2. Find the total number of automobiles exported in the year 1999.
    1. 227600
    2. 207600
    3. 217600
    4. 220000
  3. Find the ratio of cars, scooters and motorbikes exported in 1996.
    1. 25 : 16 : 19
    2. 16 : 25 : 19
    3. 19 : 16 : 25
    4. 266 : 168 : 63
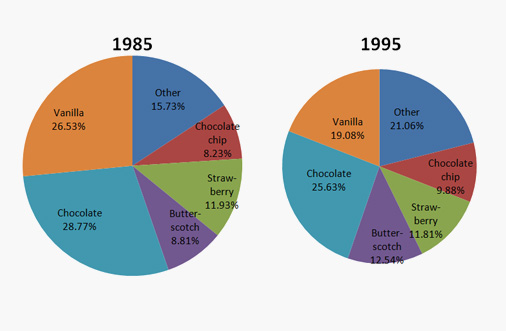
DIRECTIONS for questions 8 to 10: The pie charts below represent the popularity of ice-cream flavours in the state of Gujarat. Data Interpretation Practice Questions
  1. In 1995, if 20 % of the “Other” category is mango flavor, and 4,212 people surveyed preferred mango, then how many people were surveyed?
    1. 1,000
    2. 10,000
    3. 42,120
    4. 100,000
    5. 21,060
  2. If a percentage point shift results in annual additional sales of Rs. 50,000, how much in Rupees, did combined annual butter-scotch and chocolate chip sales increase between 1985 and 1995?
    1. Rs. 2,690
    2. Rs. 4,650
    3. Rs. 29,500
    4. Rs. 465,000
    5. Rs. 269,000
  3. Suggested Action:
    Kick start Your Preparations with FREE access to 25+ Mocks, 75+ Videos & 100+ Chapterwise Tests.
    Sign Up Now
  4. Which of the following can be deduced from the above pie-charts?
    1. Both the butterscotch and vanilla percentages increased by more than 33 % between 1985 and 1995.
    2. A higher percentage of people chose butterscotch and strawberry in 1985 than chose butterscotch and chocolate chip in 1995.
    3. The total share of vanilla, chocolate and strawberry decreased by less than 20 percent from 1985 to 1995.
    1. I only
    2. II only
    3. III only
    4. II and III only
    5. I and II only
Rate Us
Views:37594