Score Card
Student-Level Analytics

Smart Student-Level Analytics That Drive Results

Turn Every Test into a Winning Strategy

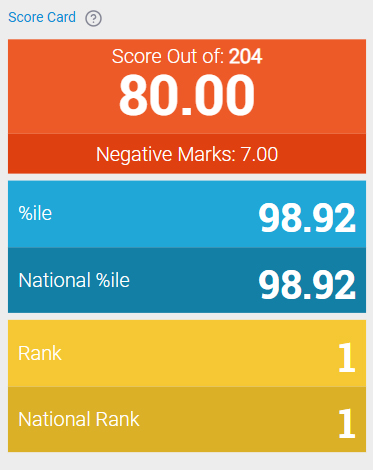
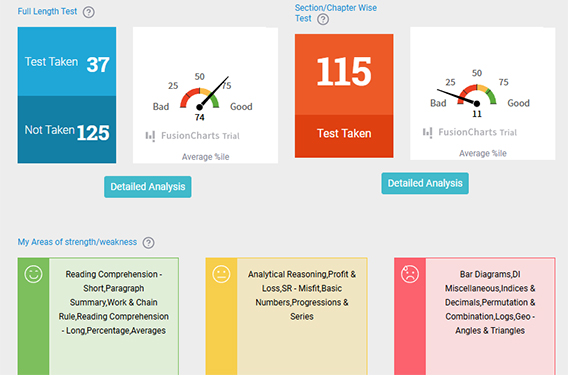
Success in competitive exams isn't about taking more tests — it's about knowing exactly what to practice, what to avoid, and how close you are to your target percentile. Our advanced student-level analytics transform every test into a clear, actionable roadmap to success.

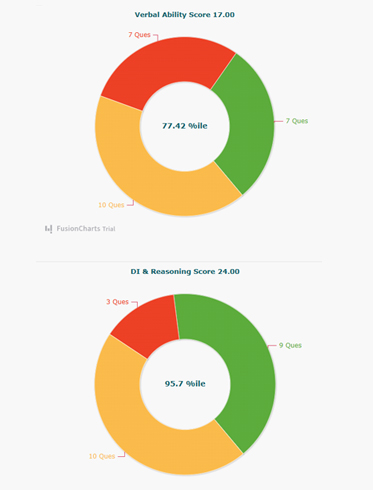
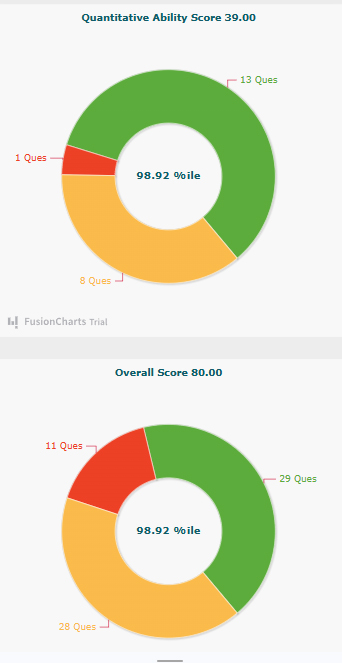
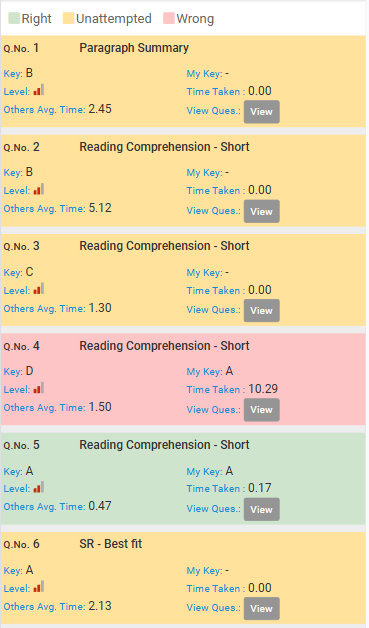
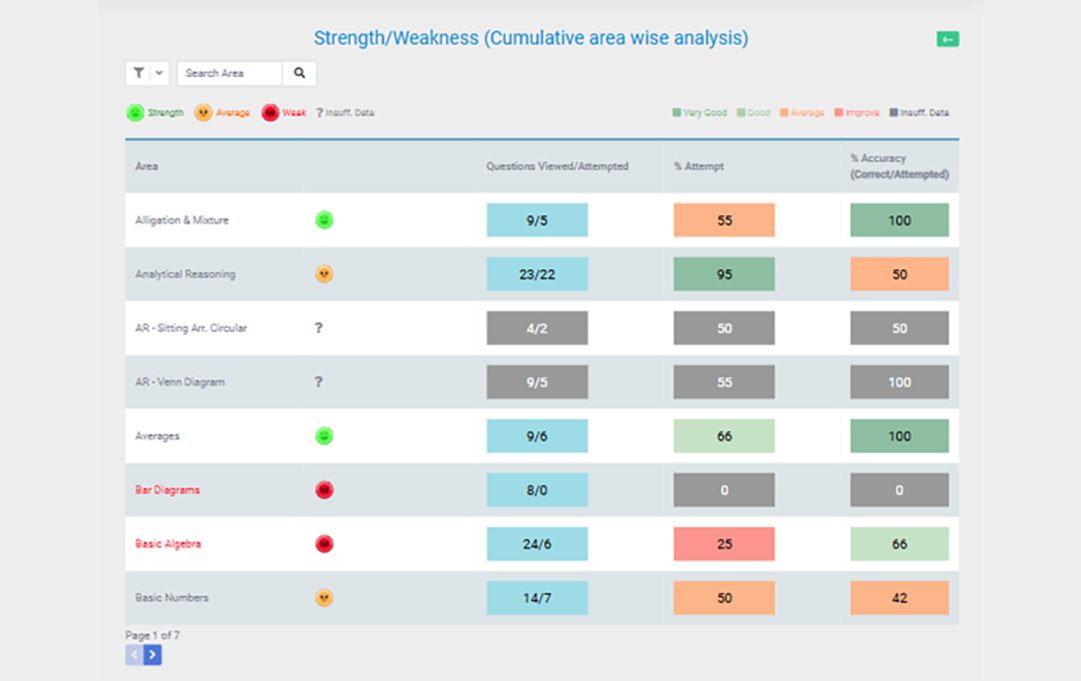
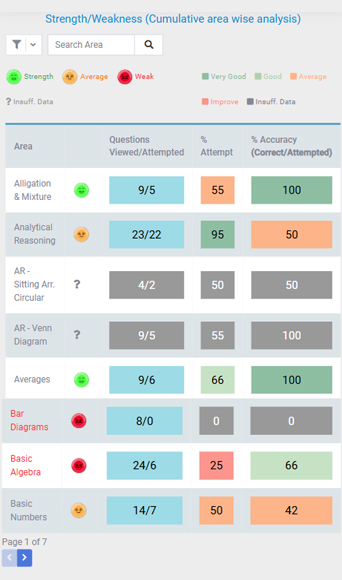
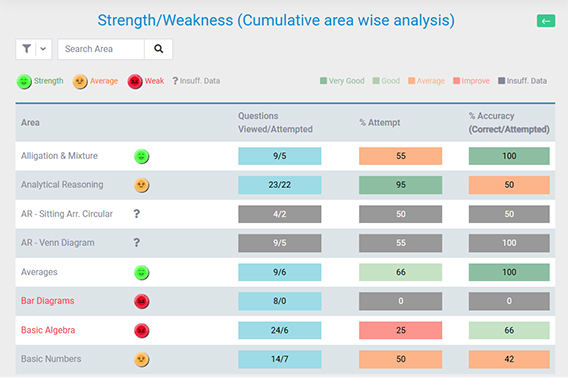
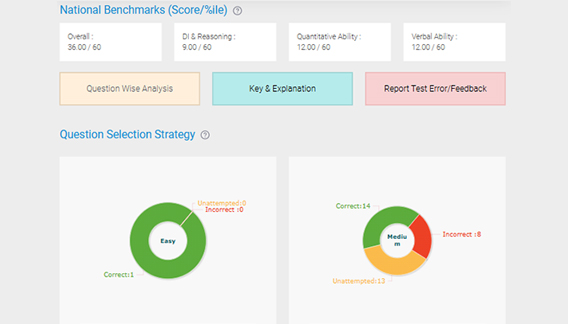
Every attempt generates rich data across three powerful lenses:

  • Single Test Analysis — deep-dive into every question, topic, and difficulty band
  • Cumulative Test Analysis — track patterns and consistency trends across multiple tests
  • Relative (National-Level) Analysis — compare your rank and speed against all test-takers nationwide
Analysis 1 of 3

Single Test Analysis

Understand every attempt in complete depth

Overall
Topic Wise
Difficulty Wise
Question Wise
Correctly and incorrectly attempted questions
Time taken per question vs. others' average time

How it will helps

  • Helps identify individual strengths and weaknesses, enabling smarter exam-specific strategies
  • Provides deep performance insights to highlight areas requiring improvement and topics that should be avoided or deferred
  • Enables topic-wise practice planning based on actual performance
  • Allows students to compare their score with current percentile benchmarks to understand the effort needed to reach a target percentile
  • Breaks down performance by difficulty level (Easy, Medium, Hard) to help students strategise — ensure all easy questions are attempted first; revisit medium and hard questions only if time permits
  • Improves question-selection strategy and time management over repeated attempts
  • Helps manage time — constant practice and comparing time taken helps identify topics more time-consuming than average
Analysis 2 of 3

Cumulative Test Analysis

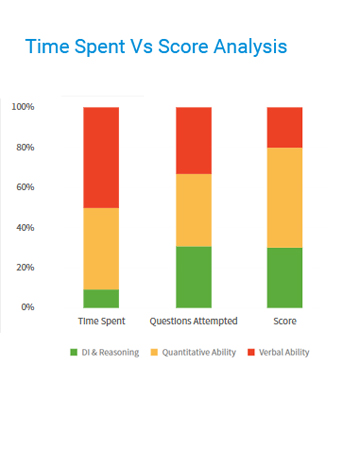
Track your preparation journey — not just one snapshot

Cumulative Coverage

What it Covers

  • Overall strengths and weaknesses across multiple tests
  • Consistency analysis over time
  • Section-wise cumulative analysis (e.g., Verbal, Quantitative Ability, DILR)
  • Average and median based on cumulative topic level results
  • Comparison of full-length tests vs topic-wise tests
  • Accuracy percentage and correct question-selection analysis
  • Categorization of topics into Strong, Average, and Weak areas
Cumulative Help

How This Helps

  • Identifies strong and weak areas based on long-term performance trends
  • Highlights consistency levels, helping students identify areas that may negatively impact final results
  • Provides section-wise cumulative analysis (e.g., Verbal, Quantitative Ability, DILR)
  • Average and median based on these cumulative topic level results help identify area of consistencies and inconsistencies
  • Compares full-length tests vs topic-wise tests to identify overall performance stability
  • Accuracy percentage reveals whether the student is selecting the right questions and following the correct test-taking strategy
  • Categorizes topics into: Strong areas, Average areas, Weak areas
Analysis 3 of 3

Relative (National-Level) Analysis

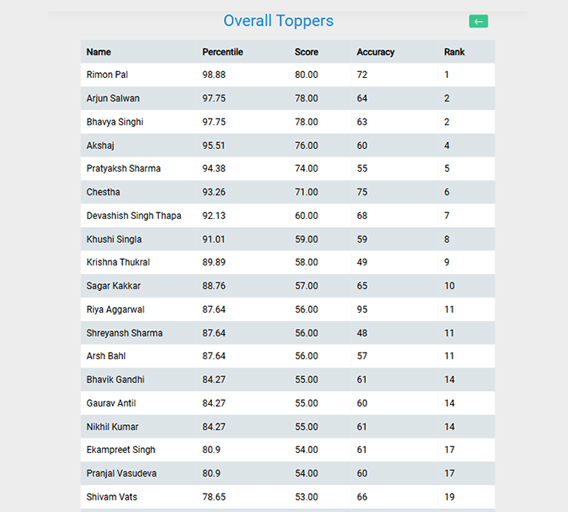
See exactly where you stand against all of India

National Coverage

What it Covers

  • Student performance compared to peers at a national level
98.27
National %ile
3
National Rank
130
Score / 204
National Help

How This Helps

  • Shows how quickly and accurately a student attempts questions compared to other test-takers
  • Provides national ranking and relative position for every test
  • Identify questions that are solved quicker than the average time to identify competitive advantage

Strategic Outcome

The combination of Single Test, Cumulative, and Relative Analysis enables students to create a focused, data-driven preparation strategy — maximizing strengths, minimizing weaknesses, and steadily progressing toward their desired percentile and final result.