What is a Venn Diagram?
Venn diagram, also known as Euler-Venn diagram is a simple representation of sets by diagrams. The usual depiction makes use of a rectangle as the universal set and circles for the sets under consideration.
In CAT and other MBA entrance exams, questions asked from this topic involve 2 or 3 variable only. Therefore, in this article we are going to discuss problems related to 2 and 3 variables.
Let's take a look at some basic formulas for Venn diagrams of two and three elements.
n ( A ∪ B) = n(A ) + n ( B ) - n ( A∩ B)
n (A ∪ B ∪ C) = n(A ) + n ( B ) + n (C) - n ( A ∩ B) - n ( B ∩ C) - n ( C ∩ A) + n (A ∩ B ∩ C )
And so on, where n( A) = number of elements in set A.
Once you understand the concept of Venn diagram with the help of diagrams, you don’t have to memorize these formulas.
Venn Diagram in case of two elements

Where;
X = number of elements that belong to set A only
Y = number of elements that belong to set B only
Z = number of elements that belong to set A and B both (AB)
W = number of elements that belong to none of the sets A or B
From the above figure, it is clear that
n(A) = x + z ;
n (B) = y + z ;
n(A ∩ B) = z;
n ( A ∪ B) = x +y+ z.
Total number of elements = x + y + z + w
Venn Diagram in case of three elements

Where,
W = number of elements that belong to none of the sets A, B or C
Tip: Always start filling values in the Venn diagram from the innermost value.
Solved Examples
Example 1: In a college, 200 students are randomly selected. 140 like tea, 120 like coffee and 80 like both tea and coffee.
- How many students like only tea?
- How many students like only coffee?
- How many students like neither tea nor coffee?
- How many students like only one of tea or coffee?
- How many students like at least one of the beverages?
Solution: The given information may be represented by the following Venn diagram, where T = tea and C = coffee.

- Number of students who like only tea = 60
- Number of students who like only coffee = 40
- Number of students who like neither tea nor coffee = 20
- Number of students who like only one of tea or coffee = 60 + 40 = 100
- Number of students who like at least one of tea or coffee = n (only Tea) + n (only coffee) + n (both Tea & coffee) = 60 + 40 + 80 = 180
Example 2: In a survey of 500 students of a college, it was found that 49% liked watching football, 53% liked watching hockey and 62% liked watching basketball. Also, 27% liked watching football and hockey both, 29% liked watching basketball and hockey both and 28% liked watching football and basket ball both. 5% liked watching none of these games.
- How many students like watching all the three games?
- Find the ratio of number of students who like watching only football to those who like watching only hockey.
- Find the number of students who like watching only one of the three given games.
- Find the number of students who like watching at least two of the given games.
Grab the Unbelievable Offer:
Solution:
n(F) = percentage of students who like watching football = 49%
n(H) = percentage of students who like watching hockey = 53%
n(B)= percentage of students who like watching basketball = 62%
n ( F ∩ H) = 27% ; n (B ∩ H) = 29% ; n(F ∩ B) = 28%
Since 5% like watching none of the given games so, n (F ∪ H ∪ B) = 95%.
Now applying the basic formula,
95% = 49% + 53% + 62% -27% - 29% - 28% + n (F ∩ H ∩ B)
Solving, you get n (F ∩ H ∩ B) = 15%.
Now, make the Venn diagram as per the information given.
Note: All values in the Venn diagram are in percentage.

- Number of students who like watching all the three games = 15 % of 500 = 75.
- Ratio of the number of students who like only football to those who like only hockey = (9% of 500)/(12% of 500) = 9/12 = 3:4.
- The number of students who like watching only one of the three given games = (9% + 12% + 20%) of 500 = 205
- The number of students who like watching at least two of the given games=(number of students who like watching only two of the games) +(number of students who like watching all the three games)= (12 + 13 + 14 + 15)% i.e. 54% of 500 = 270.
To know the importance of this topic, check out some previous year CAT questions from this topic:
CAT 2017 Solved Questions:
DIRECTIONS for the question: Read the information given below and answer the question that follows.
Applicants for the doctoral programmes of Ambi Institute of Engineering (AIE) and Bambi Institute of Engineering (BIE) have to appear for a Common Entrance Test (CET). The test has three sections: Physics (P), Chemistry (C), and Maths (M). Among those appearing for CET, those at or above the 80th percentile in at least two sections, and at or above the 90th percentile overall, are selected for Advanced Entrance Test (AET) conducted by AIE. AET is used by AIE for final selection. For the 200 candidates who are at or above the 90th percentile overall based on CET, the following are known about their performance in CET:
1. No one is below the 80th percentile in all 3 sections.
2. 150 are at or above the 80th percentile in exactly two sections.
3. The number of candidates at or above the 80th percentile only in P is the same as the number of candidates at or above the 80th percentile only in C. The same is the number of candidates at or above the 80th percentile only in M.
4. Number of candidates below 80th percentile in P: Number of candidates below 80th percentile in C: Number of candidates below 80th percentile in M = 4:2:1.
BIE uses a different process for selection. If any candidate is appearing in the AET by AIE, BIE considers their AET score for final selection provided the candidate is at or above the 80th percentile in P. Any other candidate at or above the 80th percentile in P in CET, but who is not eligible for the AET, is required to appear in a separate test to be conducted by BIE for being considered for final selection. Altogether, there are 400 candidates this year who are at or above the 80th percentile in P.
Question 1: What best can be concluded about the number of candidates sitting for the separate test for BIE who were at or above the 90th percentile overall in CET?
Question 2: If the number of candidates who are at or above the 90th percentile overall and also at or above the 80th percentile in all three sections in CET is actually a multiple of 5, what is the number of candidates who are at or above the 90th percentile overall and at or above the 80th percentile in both P and M in CET?
Question 3: If the number of candidates who are at or above the 90th percentile overall and also at or above the 80th percentile in all three sections in CET is actually a multiple of 5, then how many candidates were shortlisted for the AET for AIE?
Question 4: If the number of candidates who are at or above the 90th percentile overall and also are at or above the 80th percentile in P in CET, is more than 100, how many candidates had to sit for the separate test for BIE?
Solution: It is given that 200 candidates scored above 90th percentile overall in CET. Let the following Venn diagram represent the number of persons who scored above 80 percentile in CET in each of the three sections:
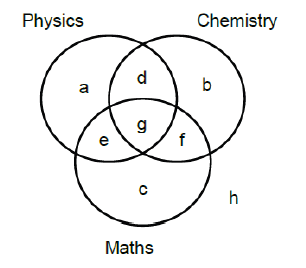 From 1, h = 0.
From 2, d + e + f = 150
From 3, a = b = c
Since there are a total of 200 candidates, 3a + g = 200 – 150 = 50
From 4, (2a + f) : (2a + e) : (2a + d) = 4 : 2 : 1
Therefore, 6a + (d + e + f) is divisible by 4 + 2 + 1 = 7.
Since d + e + f = 150, 6a + 150 is divisible by 7, i.e., 6a + 3 is divisible by 7. Hence, a = 3, 10, 17, . . .
Further, since 3a + g = 5 0, a must be less than 17. Therefore, only two cases are possible for the value of a, i.e., 3 or 10.
We can calculate the values of the other variables for the two cases.
a = 3 or 10
d = 18 or 10
e = 42 or 40
f = 90 or 100
g = 41 or 20
Among the candidates who are at or above 90th percentile, the candidates who are at or above 80th percentile in at least two sections are selected for AET. Hence, the candidates represented by d, e, f and g are selected for AET. BIE will consider the candidates who are appearing for AET and are at or above 80th percentile in P. Hence, BIE will consider the candidates represented by d, e and g, which can be 104 or 80. BIE will conduct a separate test for the other students who are at or above 80th percentile in P. Given that there are a total of 400 candidates at or above 80th percentile in P, and since there are 104 or 80 candidates at or above 80th percentile in P and are at or above 90th percentile overall, there must be 296 or 320 candidates at or above 80th percentile in P who scored less than 90th percentile overall.
1. The number of candidates sitting for separate test for BIE who were at or above 90th percentile in CET (a) is either 3 or 10.
2. From the given condition, g is a multiple of 5. Hence, g = 20. The number of candidates at or above 90th percentile overall and at or above 80th percentile in both P and M = e + g = 60.
3. In this case, g = 20. Number of candidates shortlisted for AET = d + e + f + g = 10 + 40 + 100 + 20 = 170
4. From the given condition, the number of candidates at or above 90th percentile overall and at or above 80th percentile in P in CET = 104. The number of candidates who have to sit for separate test = 296 + 3 = 299.
Another type of questions asked from this topic is based on maxima and minima. We have discussed this type in the other article.
Key Learning:
- It is important to carefully list the conditions given in the question in the form of a Venn diagram.
- While solving such questions, avoid taking many variables.
- Try solving the questions using the Venn diagram approach and not with the help of formulae.


-thumbnail_0.png?null&itok=Xhd6gz54 "CAT Formulae Book")


-thumbnail.png?null&itok=USokav20)


-thumbnail.png?null&itok=B9Rsz-Xq)