

Bar charts are one of the most frequently used methods of presenting various types of data. Questions based on such type of charts are very common in almost all the competitive exams. Usually percent change and average based questions are asked in exams through Bar charts.
What is a Bar Chart in Data interpretation?
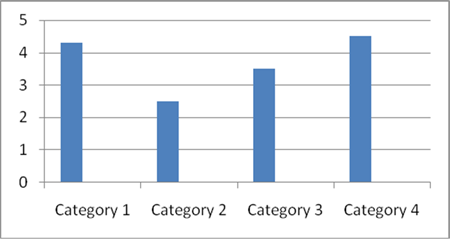
Bar chart is graphical representation of data wherein vertical bars are placed equidistant from each other. The value of the data in a bar chart is given by the length or height of the Bars. The width of the Bars are not important, it is used only for the clarity of the presentation.
Types of Bar Charts
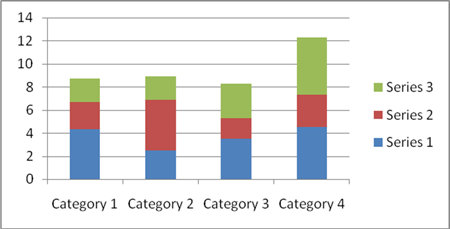
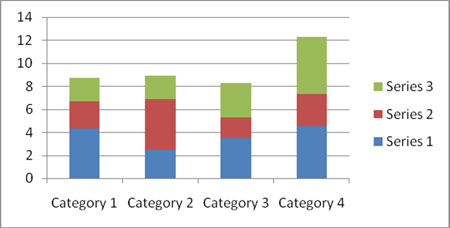
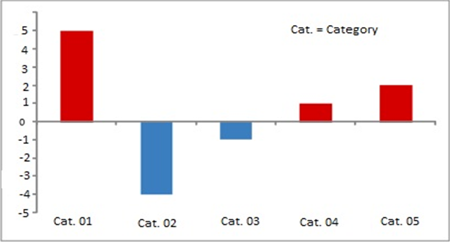
Generally, there are 4 types of Bar Charts on which questions are asked. These 4 types are:

Test your conceptual Clarity in Data Interpretation: Bar Charts. Take this test now.
Solved questions on Bar charts
DIRECTIONS: Study the following graph and answer the questions given below.
Foreign Exchange Reserves
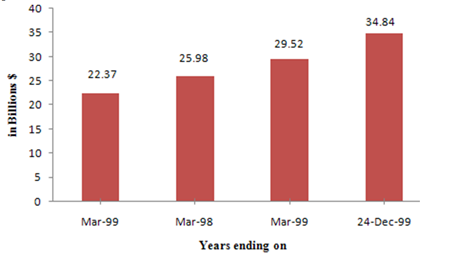
Example 1: The foreign exchange reserve in March 1998 increased by what percent as compared to the corresponding month last year?
Solution: Foreign exchange reserve in March '98 = 25.98 bn. For corresponding period last year i.e. March '97, Foreign exchange reserve = 22.37 bn.
Increase in foreign exchange reserve = 3.61 bn. Percentage increase = 100 × 3.61/22.37 = 16.13%. Alternative: Besides this, it can also be seen that 10% of the base i.e. 22.37 is 2.2 and 15% will be 3.3. Hence, the answer has to be slightly greater that 15%. Hence answer will be 4th option.Example 2: The foreign exchange reserve in March 1997 was ----- % less than what was in March 1998.
Solution: Foreign exchange reserve in March '98 = 25.98 bn
Foreign exchange reserve in March '97 = 22.37bn Decrease in foreign exchange reserve = 3.61bn Percentage decrease = 100×3.16/25.98 = 13.9% Alternative: Besides that, it can also be seen that 10% of the base i.e. 25.98 is approximately 2.6 and 15% will be 3.9. Hence, the answer has to be more than 10% and less than 15%. Hence, the 3rd option is the answer.Example 3: The average rate of increase per year of foreign exchange reserve in India from March 1997 to March 1999 was approximately
Solution: Foreign exchange reserve in March '97 = 22.37 bn.
Foreign exchange reserve in March '99 = 29.52 bn. Increase in foreign exchange reserve = 7.15 bn. Percentage increase in two years = 100 × 7.15/22.37 = 32%. Average rate of increase per year = 32/2 = 16%. It can noted here that the increase of 7.15 is roughly one-third of 22 i.e. 33.33%. For every year it will become 33/2 = 16.5%. Hence, 2nd option is the answer.Example 4: What was the average foreign exchange reserve for the three years i.e. March 1997, March 1998 and March 1999, approximately?
Solution: From questions 1 and 2, the difference between March '97, '98 and '99 is almost same. Thus, the average would be the middle value i.e $ 25.98 Billion = $ 26 billion. Hence, the answer is 1st option.
Are you ready for advanced questions on Data Interpretation: Bar Charts? Take this test and know for yourself.
Data Interpretation - Bar Chart : Key Learning
For any query about the topic or any other information, do write in the comment box given below.


 Talk to Our Expert


